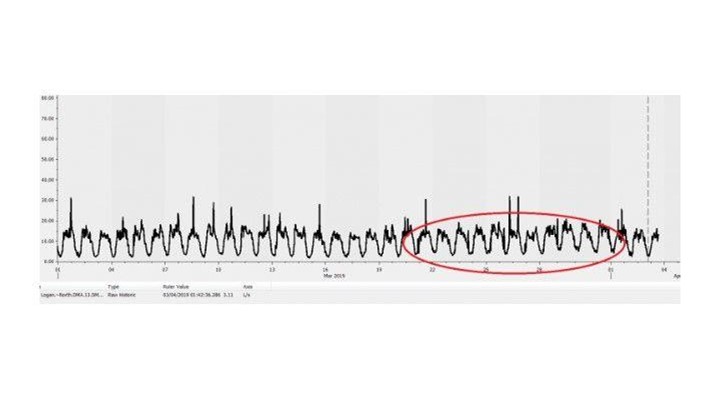
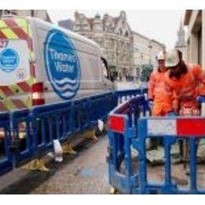
On 25th of March 2019 the Logan City Council receives a customer call to report water that is coming up in a driveway. The Water Operations branch team around John Christie, Steve Young and Angus Heares investigate the SCADA data and indeed confirm an increase in the night line on the 21st of March.
Pinpointing the leak
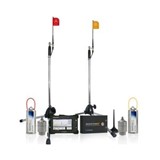
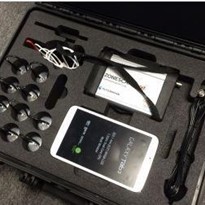
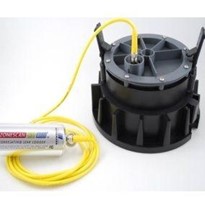
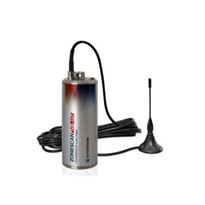
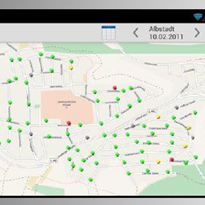
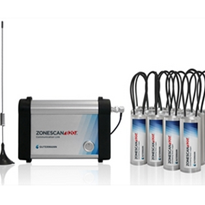
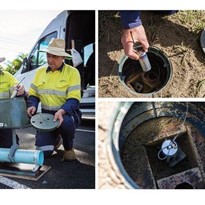
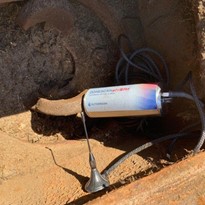
In the next couple of days, the Water Operations team deploys a number of ZONESCAN 820 loggers in the suspected area using a tablet with the Android app ZONESCAN Smart. After reading out the loggers, the team then uploads the measurements to the cloud account in ZONESCAN Net for further offline analysis.
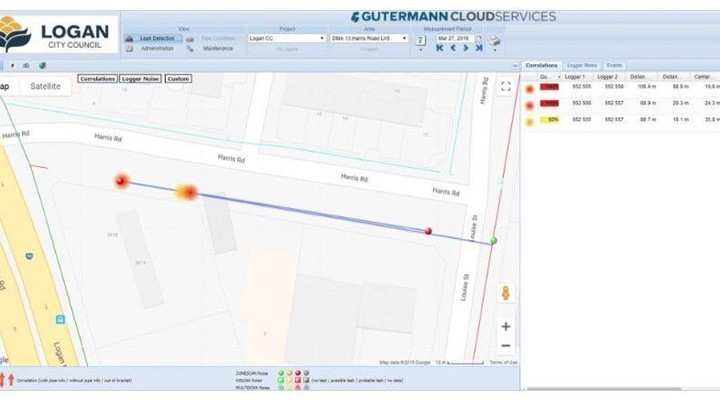
Several correlations could be seen on the GIS pipe network that had been imported as KML file as layer on Google Maps. So Steve Young turns to Gutermann for a little advice on making the most out of the data.
Using the pipe wizard to get the best result
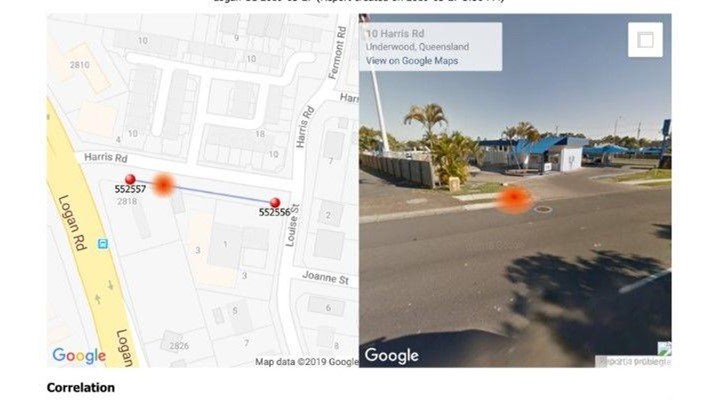
Using his administrator access Gutermann’s Julian Wilkinson logs into ZONESCAN Net on the Gutermann Cloud. He feels that the embedded GIS data may not be 100% accurate for this location, so he deactivates it and used the ZONESCAN Net pipe wizard tool to re-create the pipe lining, and he checks that the loggers are in the correct location using street view. The result is shown on this automated correlation report from ZONESCAN Net with a 100% quality correlation:
Verifying and excavating the pinpointed leak position
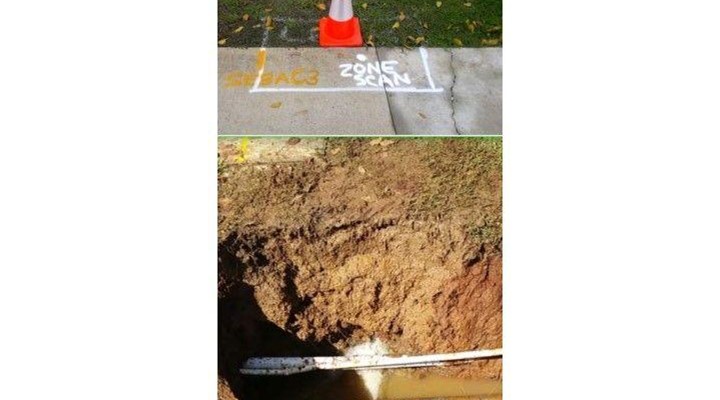
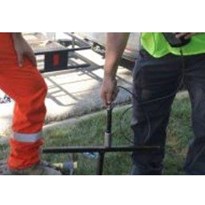
On Friday 29th March 2019 Steve and John go on site to verify the leak pinpointed by the ZONESCAN 820 loggers using an acoustic listening stick and to mark the position. Steve then goes back on site on Saturday morning to correlate the pipe segment with a real-time correlator of a different brand to make sure he’s got the right position to excavate.
On Monday 1st April the team undertakes the excavation works. The team finds a cracked 100mm Asbestos Cement main. The main is lying directly over a sewer trench allowing the leak to escape through the 5mm gravel and flow down the road for approximately 350 metres where it resurfaces.
The team is very pleased with the results. As shown on the photo, ZONESCAN was able to pinpoint the leak position virtually at the exact position with the correlator being off by about 40cm which is still a great result.
Measuring the costs
After repairing the leak, the Water Operations branch team went back and recorded this leak in its database. “We use an excel spreadsheet to keep track of all of our leaks including leak runtimes, leak volumes and costs per KL. The Harris Road leak was running for an estimated 288 hours (12 days) at a volume of ca. 60 litres per minute,” says Steve Young.
“The losses of this leak amounted to a total of about 1 million litres which equates to more than $3,000 worth of water! Running for an entire year this would cost us more than $90,000.”
Moving to fixed network
Logan City Council are evaluating their lift & shift ZONESCAN loggers and the Gutermann Cloud for a little longer. The goal will be to install a fixed network monitoring system in order to pick up and pinpoint leaks right away and not wait for customers to call in leak incidents. ZONESCAN Alpha will be the right solution for that.


